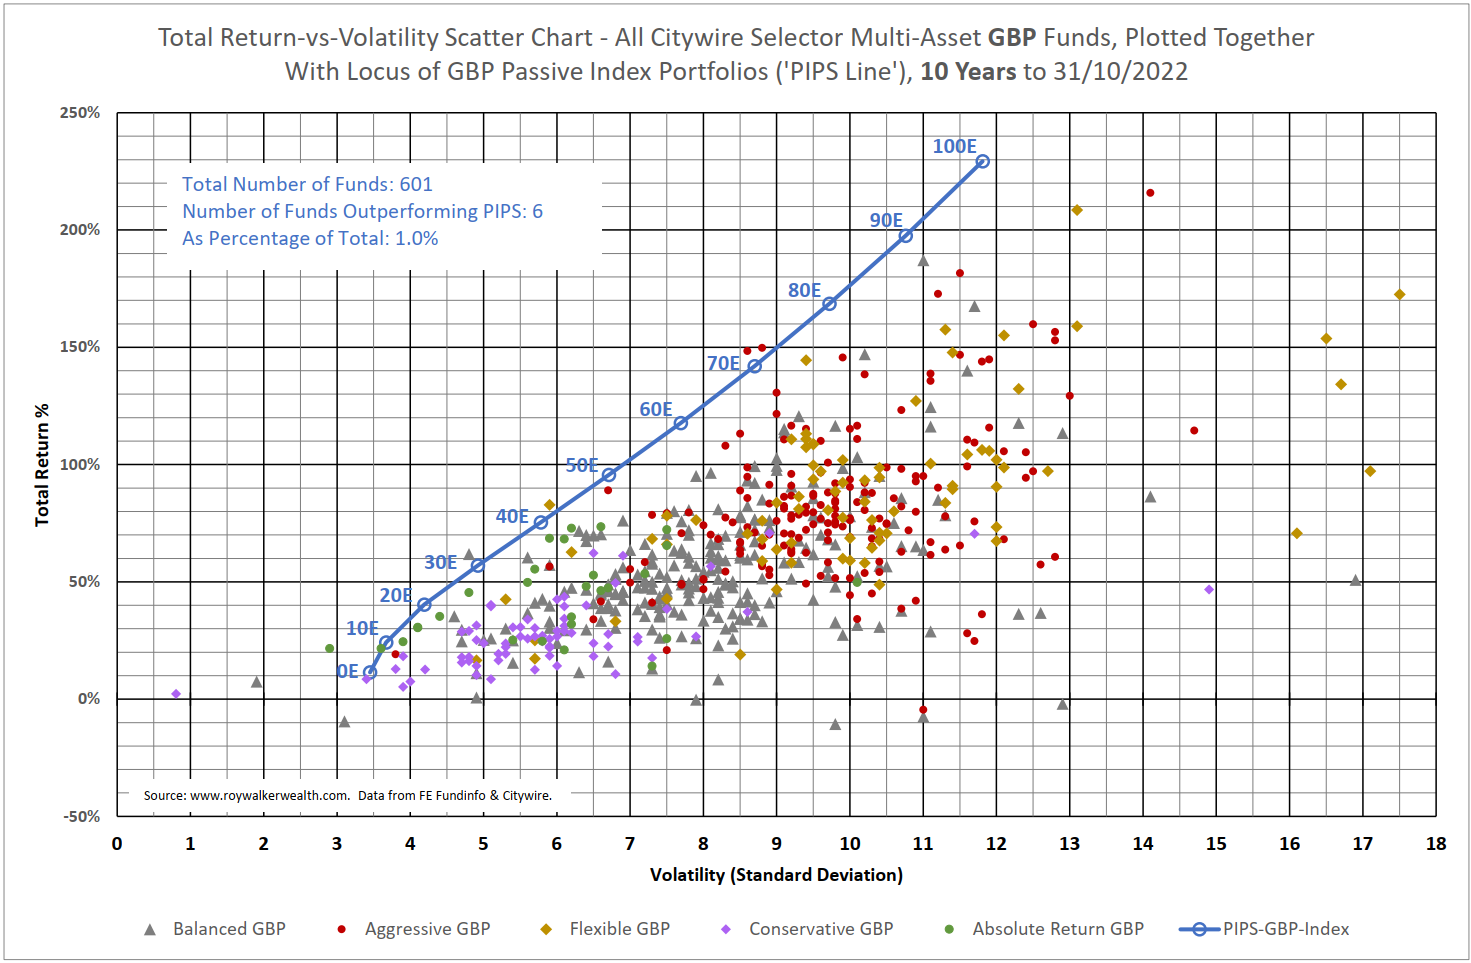
With the rising popularity of 'portfolio-in-a-fund' multi-asset funds, I considered how best to benchmark and evaluate such investments. Unlike the world of single-asset-class or sub-class funds, which is overflowing with indices against which to benchmark, there isn't a generally agreed upon and available set of indices for multi-asset funds.
I started where anyone in our industry might start, passive index portfolios (PIPS) comprised of just one global equity index and one global bond index. A locus formed by varying the relative proportion of equities and bonds and plotting on a risk-return chart, which I called a 'PIPS-line', seemed to fit the bill as an easy-to-use benchmark.
To test it out, I analysed every multi-asset fund on Citywire with 10 years of data, denominated in GBP, USD, EUR and AUD. Of the 4468 funds examined, I was utterly gobsmacked to discover that only 178 (less than 4%) outperformed the PIPS benchmark.
Below is the scatter chart for the GBP fund data. For more charts, download the paper.


Post a Comment
Love it? Hate it? Please tell everyone what you think... (Your personal information is kept private. Comments are moderated.)